Figures Demo
This page demonstrates the .. plot:: directive from
matplotlib.sphinxext.plot_directive for auto-generating
figures at documentation build time.
Ellipsoid iterations
"""
Ellipsoid iterations
====================

The ellipsoid search space shrinks as cutting planes are applied.
Initial ellipsoid (blue) is narrowed to the final ellipsoid (orange)
after 10 iterations of the cutting-plane method.
"""
import matplotlib.pyplot as plt
import numpy as np
from matplotlib.patches import Ellipse as MplEllipse

from ellalgo import Ell


def ell_to_patch(ell: Ell, **kwargs):
    """Convert an Ell object to a matplotlib Ellipse patch."""
    # ellipsoid: (x - xc).T * M^(-1) * (x - xc) <= kappa^2
    # M = _mq, axes from eigenvectors, radii = kappa * sqrt(eigenvalues)
    eigvals, eigvecs = np.linalg.eigh(ell._mq)
    # Ensure positive eigenvalues
    eigvals = np.maximum(eigvals, 1e-12)
    width = 2 * ell._kappa * np.sqrt(eigvals[0])
    height = 2 * ell._kappa * np.sqrt(eigvals[1])
    angle = np.degrees(np.arctan2(eigvecs[1, 0], eigvecs[0, 0]))
    return MplEllipse(xy=ell._xc, width=width, height=height, angle=angle, **kwargs)


# Run a simple cutting-plane feasibility problem in 2D
class SimpleOracle:
    """Feasibility: x[0] + x[1] <= 1, x[0] >= 0, x[1] >= 0"""

    def assess_feas(self, xc):
        if xc[0] + xc[1] > 1:
            return (np.array([1.0, 1.0]), 0.0)  # cut: x+y <= 1
        if xc[0] < 0:
            return (np.array([-1.0, 0.0]), 0.0)  # cut: x >= 0
        if xc[1] < 0:
            return (np.array([0.0, -1.0]), 0.0)  # cut: y >= 0
        return None  # feasible


ell = Ell(10.0, np.array([5.0, 5.0]))
snapshots = []

for _ in range(10):
    snapshots.append((ell._xc.copy(), ell._mq.copy(), ell._kappa))
    cut = SimpleOracle().assess_feas(ell._xc)
    if cut is None:
        break
    ell.update_bias_cut(cut)

fig, ax = plt.subplots(figsize=(6, 6))
# Plot initial ellipsoid
init_eigvals, _ = np.linalg.eigh(snapshots[0][1])
rad = 2 * snapshots[0][2] * np.sqrt(np.maximum(init_eigvals, 1e-12))
patch = ell_to_patch(
    type(
        "_",
        (),
        {"_xc": snapshots[0][0], "_mq": snapshots[0][1], "_kappa": snapshots[0][2]},
    )(),
    fill=False,
    edgecolor="#1565C0",
    linewidth=2,
    label="Initial",
)
ax.add_patch(patch)

# Plot final ellipsoid
final = snapshots[-1]
patch = ell_to_patch(
    type("_", (), {"_xc": final[0], "_mq": final[1], "_kappa": final[2]})(),
    fill=False,
    edgecolor="#E65100",
    linewidth=2,
    label=f"Iter {len(snapshots)}",
)
ax.add_patch(patch)

# Plot center points
init_xc = snapshots[0][0]
ax.plot(init_xc[0], init_xc[1], "o", color="#1565C0", markersize=8)
final_xc = final[0]
ax.plot(final_xc[0], final_xc[1], "s", color="#E65100", markersize=8)

# Shade feasible region
xs = np.linspace(-1, 6, 5)
ys = np.linspace(-1, 6, 5)
X, Y = np.meshgrid(xs, ys)
Z = np.maximum(0, np.maximum(X + Y - 1, np.maximum(-X, -Y)))
ax.contourf(X, Y, Z == 0, levels=[-0.5, 0.5], colors=["#C8E6C9"], alpha=0.4)

ax.set_xlim(-2, 8)
ax.set_ylim(-2, 8)
ax.set_aspect("equal")
ax.set_title("Ellipsoid shrinking via cutting planes")
ax.set_xlabel("x₁")
ax.set_ylabel("x₂")
ax.legend()
ax.grid(True, alpha=0.3)
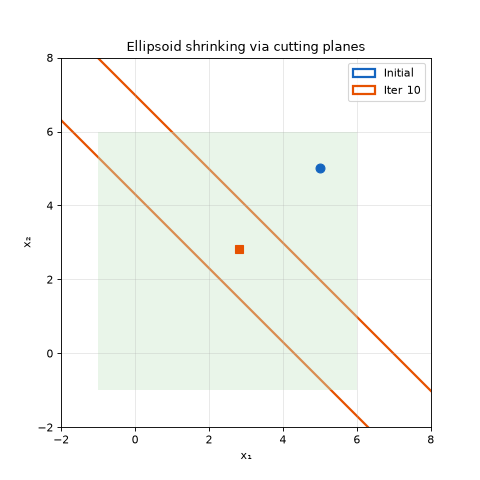
The ellipsoid search space shrinks as cutting planes are applied. The initial (outer) and final (inner) ellipsoids are shown with the feasible region shaded in green.
LMI feasibility
"""
LMI feasibility
===============

Solving a 2D Linear Matrix Inequality using the ellipsoid method.
The ellipsoid (blue) shrinks toward the feasible region (green).
"""
import matplotlib.pyplot as plt
import numpy as np
from matplotlib.patches import Ellipse as MplEllipse

from ellalgo import Ell, cutting_plane_feas
from ellalgo.oracles.lmi_oracle import LMIOracle

# LMI constraint: B - (F1*x1 + F2*x2) >= 0
# B = [[2, 0], [0, 1]], F1 = [[1, 0], [0, 0]], F2 = [[0, 0], [0, 1]]
B = np.array([[2.0, 0.0], [0.0, 1.0]])
F1 = np.array([[1.0, 0.0], [0.0, 0.0]])
F2 = np.array([[0.0, 0.0], [0.0, 1.0]])

omega = LMIOracle([F1, F2], B)
space = Ell(5.0, np.array([0.0, 0.0]))

# Take snapshots during iterations
snapshots = []
ell = space  # reference
for _ in range(15):
    snapshots.append((ell._xc.copy(), ell._mq.copy(), ell._kappa))
    cut = omega.assess_feas(ell._xc)
    if cut is None:
        break
    ell.update_bias_cut(cut)

x_best, _ = cutting_plane_feas(omega, space)

fig, ax = plt.subplots(figsize=(6, 6))

# Plot selected snapshots (fading colors)
n = len(snapshots)
for i, (xc, mq, kappa) in enumerate(snapshots):
    alpha = 0.3 + 0.7 * (i / n) if n > 1 else 0.6
    eigvals, eigvecs = np.linalg.eigh(mq)
    eigvals = np.maximum(eigvals, 1e-12)
    w = 2 * kappa * np.sqrt(eigvals[0])
    h = 2 * kappa * np.sqrt(eigvals[1])
    angle = np.degrees(np.arctan2(eigvecs[1, 0], eigvecs[0, 0]))
    patch = MplEllipse(
        xy=xc,
        width=w,
        height=h,
        angle=angle,
        fill=False,
        edgecolor="#1565C0",
        linewidth=1.2,
        alpha=alpha,
    )
    ax.add_patch(patch)

# Plot center trajectory
centers = np.array([s[0] for s in snapshots])
ax.plot(
    centers[:, 0],
    centers[:, 1],
    "o-",
    color="#1565C0",
    markersize=4,
    linewidth=0.8,
    alpha=0.6,
    label="Ellipsoid centers",
)

# Mark final solution
if x_best is not None:
    ax.plot(
        x_best[0],
        x_best[1],
        "*",
        color="#E65100",
        markersize=15,
        label=f"Solution ({x_best[0]:.2f}, {x_best[1]:.2f})",
    )

ax.set_xlim(-6, 6)
ax.set_ylim(-6, 6)
ax.set_aspect("equal")
ax.set_title("LMI Feasibility via Ellipsoid Method (15 iterations)")
ax.set_xlabel("x₁")
ax.set_ylabel("x₂")
ax.legend()
ax.grid(True, alpha=0.3)
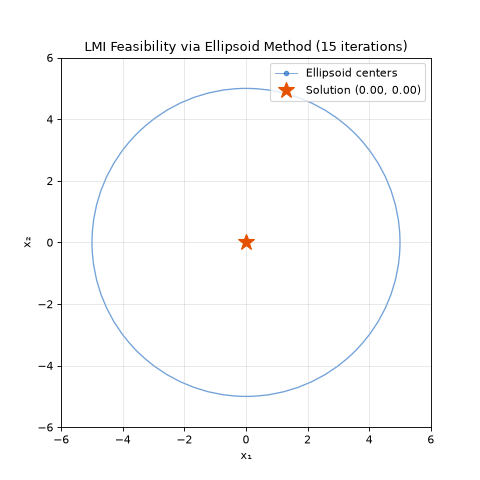
Solving a 2D Linear Matrix Inequality constraint using the ellipsoid method. Each snapshot shows the shrinking ellipsoid, with the final solution marked by a star.